


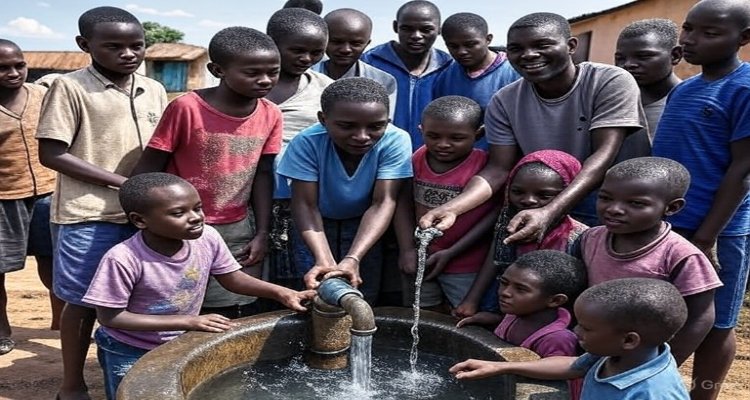
Global Situation: Access to Water, Sanitation & Hygiene (WASH)
-
“Explore the 2025 WHO & UNICEF report on global water, sanitation, and hygiene progress. Discover key stats on access inequalities, challenges, and progress toward safe drinking water for 2.1 billion people.”
(Length: ~155 characters — clear, concise, includes keywords like “WHO”, “UNICEF”, “water”, “sanitation”, “progress”, and entices clicks)
Progress (2000–2024)
Population Growth:
-
-
2000: 6.2 billion people
-
2024: 8.2 billion people
-
-
Drinking Water Access:
-
Safely managed services: Increased from 3.8 billion to 6 billion (+2.2 billion).
-
No basic drinking water: Decreased from 1.1 billion to 696 million.
-
Since 2015, 961 million gained access to safely managed services.
Country Achievements:
-
89 countries already at >99% basic access.
-
31 countries reached universal safely managed access; projected 38 by 2030.
-
-
-
Categories of Drinking Water (JMP definitions)
-
Surface water: direct, untreated water from rivers/lakes/canals.
-
Unimproved: unprotected dug wells/springs.
-
Limited: improved source but >30 mins round trip to collect.
-
Basic: improved source, ≤30 min round trip.
-
Safely managed: improved source, accessible on premises, available when needed, free from contamination.
Key Data (2024)
-
Of the 2.1B without safely managed drinking water:
-
1.4B had a basic service
-
287M used limited services
-
302M used unimproved sources
-
106M used surface water
-
-
Sanitation:
-
3.4B lacked safely managed sanitation
-
354M practiced open defecation
-
-
Hygiene:
-
1.7B lacked basic facilities (incl. 611M with none at all)
-
Inequalities
-
Least developed countries (LDCs):
-
2× more likely to lack basic water/sanitation
-
3× more likely to lack basic hygiene
-
-
Fragile contexts:
-
Safely managed water coverage 38% lower than stable countries
-
-
Rural vs. Urban:
-
Rural water coverage improved (50% → 60%) and hygiene (52% → 71%) between 2015–2024.
-
Urban coverage stagnating.
-
-
Gender burden:
-
Women & girls remain primary water collectors in many regions (30+ minutes/day).
-
Menstrual health gaps persist: many lack sufficient materials and privacy.
-
Adolescent girls miss school, work, or social activities during menstruation more often than adults.
-
Outlook & Challenges
-
Significant progress, but SDG 6 (universal access to water & sanitation by 2030) is off track.
-
Ending open defecation and achieving basic universal WASH services by 2030 is possible with acceleration.
-
Universal safely managed services increasingly appear out of reach unless investment and focus intensify.
-
Disclaimers:
Geographic Variation: Access to water and sanitation varies widely by region and socio-economic factors; the infographic shows global and aggregate data, which may not reflect local realities.Purpose: This infographic is for informational and educational purposes only and does not substitute professional advice or policy guidance.Future Projections: The predictions about future access and SDG targets are based on current trends and may change with new interventions or global events.